A Combined Result Doesn’t Say Which Channel Earned It
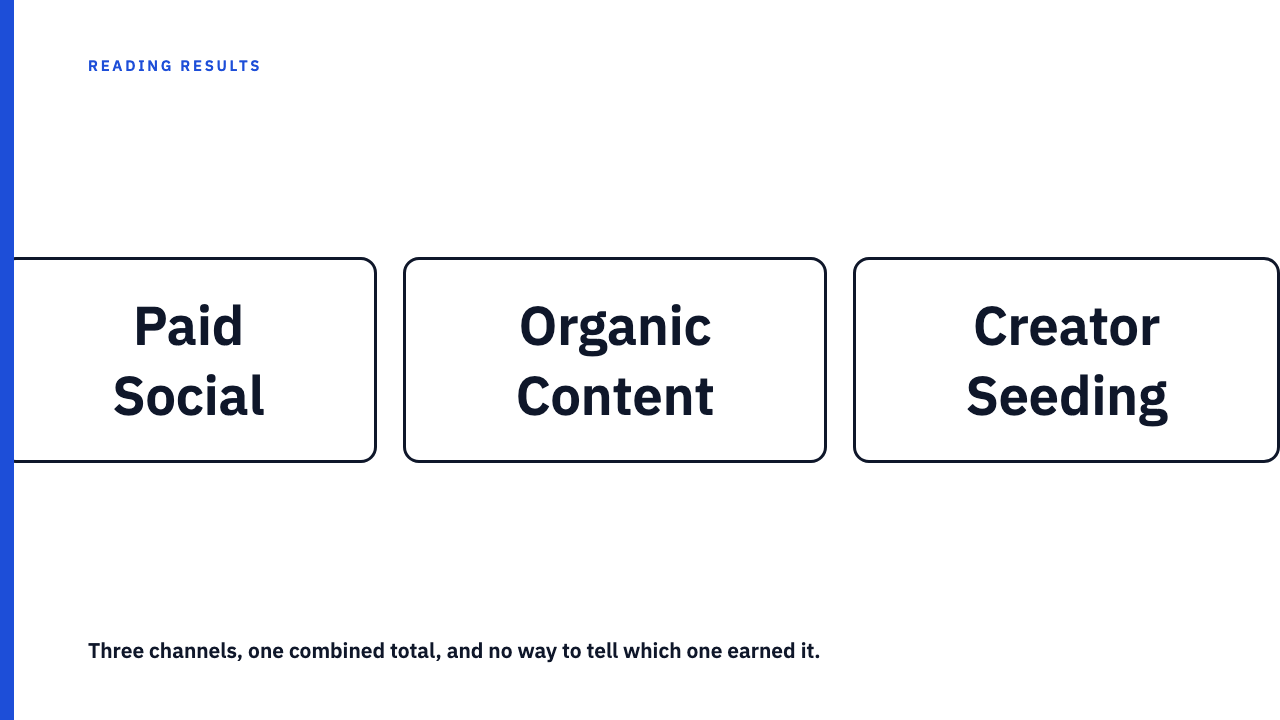
The case study lists three services: paid social, organic content, and creator seeding. Then it reports one number, and asks you to believe the strategy worked. What you have is a total that three separate things could have produced, in any proportion, with nothing to tell them apart.
The habit of crediting ‘social strategy’ for a number no one channel can own
Those three services are not variations on one activity. Media spend is money handed to a platform for distribution. Organic content is production cost against an audience the brand already owns. Creator fees buy access to somebody else’s audience and somebody else’s credibility. Three budget lines, three mechanisms, three different things that could have moved the number.
So “the social strategy worked” is a claim about the sum, not about any one of them. A reader who credits the agency’s strategic thinking is crediting something the case study never isolated. The combined figure fits a campaign where the creative carried everything, and one where the creative was ignored and the budget bought the result.
What each lever could be doing entirely on its own
What can each channel produce with zero contribution from the other two?
- Paid social. Media spend buys distribution directly. Reach and impressions are purchased, not earned, and they arrive whether or not the creative resonated with anyone. A large enough budget produces a large impression count on its own.
- Organic content. With no media budget at all, posts still reach some share of existing followers plus whatever the ranking shows beyond them. That baseline existed before the campaign and would have continued during it, which is why the counterfactual no case study can show you matters here.
- Creator seeding. A creator’s post reaches their following, using their credibility, on their account. Seed to creators with large audiences and much of the result belongs to audiences assembled before the brand arrived.
The same combined number, split three different ways
Here is a hypothetical with invented numbers. No real agency, brand, or case study is involved, and nothing below should be quoted as a reported result.
Picture a case study for a home goods brand reporting 1.8 million impressions across an eight week campaign, all three channels listed as services. Two splits that both sum to that total:
| Channel | Split A | Split B |
|---|---|---|
| Paid social | 1,400,000 | 300,000 |
| Organic content | 250,000 | 200,000 |
| Creator seeding | 150,000 | 1,300,000 |
| Reported total | 1,800,000 | 1,800,000 |
Split A is a campaign where the media budget did the work. Split B is one where a couple of large creators delivered nearly everything. Opposite stories about what the agency is good at, identical headline. The single number cannot tell you which happened, or which of the many other splits totalling 1.8 million did instead. Without disclosure, that answer is not recoverable.
The breakdown a case study owes you before you credit the whole strategy
The useful response is to name what would settle the question:
- Paid results from the ad platform’s own reporting, stated separately. Ad platforms report campaign-attributed results inside their own interfaces, distinct from an account’s general activity, so this number exists somewhere. Good looks like an impressions or conversions figure for the paid campaign, alongside the spend that produced it.
- Organic reach for the same window, with paid excluded. Not a campaign-level blend. Good looks like a figure for those eight weeks noted as excluding amplified posts, beside the equivalent figure for the eight weeks before. A percentage lift with no underlying number is not this.
- The creator’s own baseline. Follower count and typical engagement rate before the campaign, so the seeding contribution can be weighed against what that audience produced anyway. Without it you cannot tell whether the creator’s numbers were a campaign effect or a Tuesday.
The pattern across all three: a specific number cited to its own source, not a percentage of a total nobody disclosed. See also why the best metric on a dashboard is rarely the real story.
Why agencies bundle the number instead of breaking it out
Some of this is structural. Integrated social work is often sold as one retainer and staffed as one team, so the agency’s own reporting may never have separated the channels. The combined figure is then the only one that exists, a real limitation rather than dishonesty.
The other possibility is a reporting choice. One large number is a cleaner headline than three smaller ones, and three invite the question of which channel was worth the fee. Your job is to work out which of the two you are looking at, not to assume the second by default.
When the bundle is legitimately hard to unbundle
Even good-faith reporting will not produce three sealed columns. Paid amplification behind an existing post can increase that post’s total reach through the platform’s own distribution, and the resulting audience does not divide neatly into people who would have seen it anyway and people the money bought. That is a real effect, not an accounting failure, and the wider version of the two-channel problem in an ‘organic’ result with paid spend behind it.
So the reasonable ask is not perfect isolation, it is a shown breakdown with the overlaps named. Three figures plus a note that two of them reinforced each other beats a silent total, because it shows you where the uncertainty sits.
Read the next one with this in hand
Every case study in the library is another agency’s work, and its numbers are theirs. Browse the case study library and try naming the missing breakdown as you read, or submit your own. New to this? Start with how to read a marketing case study without being misled.
FAQ
If an agency ran paid, organic, and influencer seeding together, can they ever prove which one worked?
Not with certainty, and demanding certainty is the wrong standard. What narrows it is per-channel numbers from each channel’s own reporting: the ad platform’s attributed results, organic insights with amplified posts excluded, and the creator’s analytics from before the campaign. Each estimates what that lever would have produced alone, the question the combined total skips.
What is a red flag versus a legitimate limitation in a multi-channel case study?
A red flag is one combined number next to a list of three services, with no breakdown offered and no acknowledgement that one would be relevant. A legitimate limitation is a breakdown that is offered but flags where the channels overlapped. The difference is not how clean the numbers are. It is whether the piece tells you what it does not know.