A Case Study’s Growth Curve Can Predate the Agency Claiming It
A case study opens with a familiar line: “When we took over this account.” Underneath it, a chart climbing from left to right. The chart has months on its axis, the sentence has no date. Where on that rising line does the credited agency actually start?
The takeover opening is a claim about timing, not just about work
A takeover framing does something quietly structural: it draws a vertical line on the timeline and assigns everything to the right of it to the incoming agency.
But the line is drawn in prose, not on the chart. “When we took over” is a narrative beat, not a calendar date. The reader carries that fresh start onto a graph that may begin somewhere else, and every printed number can still be accurate.
What can already be in motion when a new agency arrives
An account is not a blank page on the day a contract is signed. Marketing work has lag, and some of it keeps producing after its builders have gone:
- An established content calendar or posting cadence. A rhythm that took months to settle into does not reset because the invoice does.
- An audience already built. Followers acquired by earlier campaigns are still there, still forming the reach base for what comes next.
- A creative system or template already tested. If a format was found to work, the incoming team can inherit it, and its performance lands on the new agency’s chart.
- A paid campaign still running out its flight. Spend committed under the previous engagement can be delivering impressions well into the new one.
Keep this separate from a business-side confound like a price cut, a product launch or a press hit. Those break attribution too, through a different mechanism.
A hypothetical timeline: same chart, two different start lines
What follows is hypothetical, with no real agency or client behind it and every number invented for illustration. Picture an account whose content system rollout finishes at the end of month 1, with monthly reach at 100 units. Through months 2 and 3 the system beds in and reach climbs to 180. A new agency’s contract begins in month 3. By month 12, reach is at 400.
The chart begins at month 1. Read against that axis, growth is 300 percent. Measured from the contract start in month 3, it is roughly 122 percent. Both figures are arithmetically correct, and neither is fabricated in bad faith. They answer different questions: what happened to this account across the shown period, and what happened after this agency was hired. A takeover framing invites you to read the first as if it were the second.
The three dates worth separating before you accept the credit
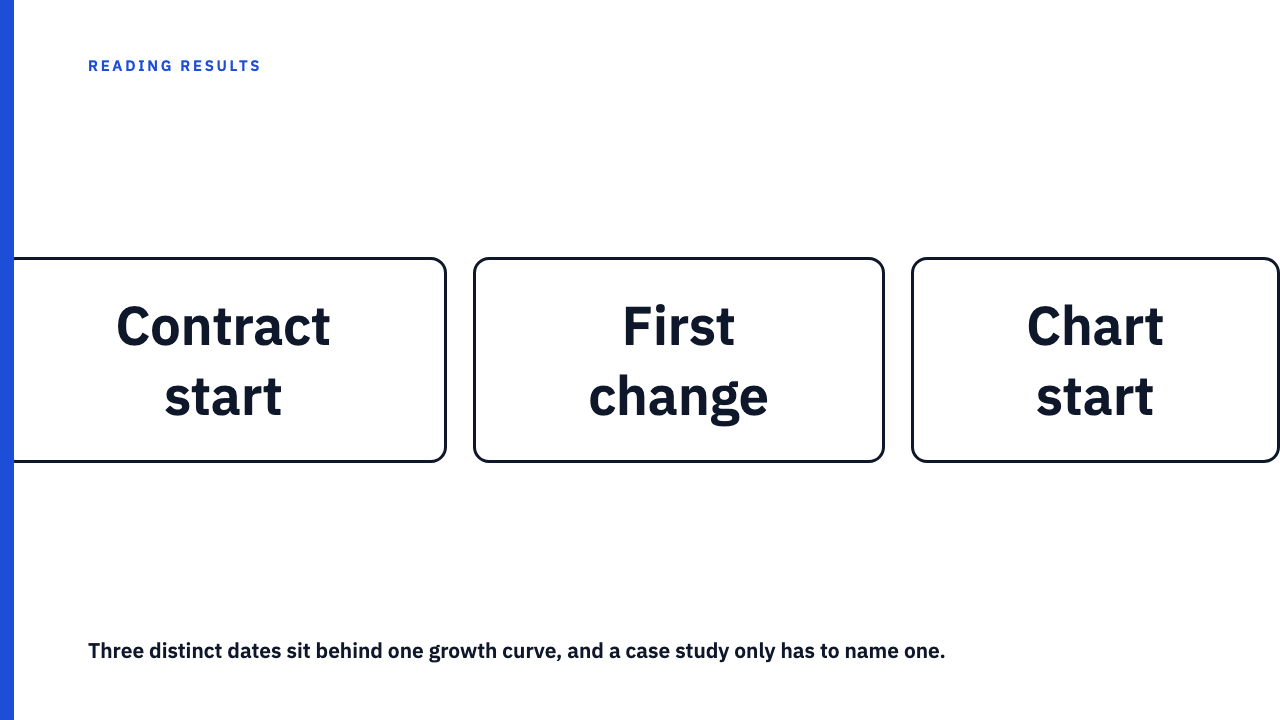
There are three distinct dates in play, and a case study only has to disclose one of them to look complete.
- The contract or engagement start date. When the new agency was hired and started being paid.
- The first-content or first-change date. When something visibly different went live, a new format, a changed cadence, a redesigned asset. This is when their work could plausibly have moved the line.
- The chart start date. Where the reported curve begins on its axis, and therefore what period the headline number measures.
These are frequently not the same date. A case study that names only the chart start has told you everything about the measurement window and nothing about the attribution window, the same gap covered in the attribution window is a choice.
Why this is easy to miss and easy to write in good faith
The uncharitable reading is that the writer knew and chose the flattering line. Often that is not what happened, because structural momentum is hard to date, including from the inside. An incoming team can see that a format works without knowing when it started working, or when it would have plateaued had nobody touched it. That comparison is unavailable to them for the same reason it is unavailable to you: it is the counterfactual no case study can show you.
The implication for you survives all of that. Good faith does not convert a whole-period figure into a clean measure of one agency’s contribution.
What to do with a case study that does not separate the dates
You do not have to reject it. Treat an undated takeover claim as an upper bound on what the credited agency can be responsible for, rather than a settled figure. The real contribution sits at or below it, and the case study has not told you where.
Then look for a visible marker of a genuine handoff: a stated format change, a rebrand, a platform switch. Any of these is a rough proxy for when the new work started, and you can read the curve on either side of it.
Read more of them, or add one
Browse the case study library, where every study is credited to the agency that published it, or submit your own.
FAQ
Does a takeover case study always overstate what the new agency did?
No. Overlap is a possibility to check for, not a default assumption, and a takeover case study can be attributed perfectly honestly with a clear engagement start. The point is narrower: without a stated start date, you cannot tell which kind you are holding.
What is the single most useful date to look for in a takeover case study?
The first-content or first-change date, the point where something visibly different actually went live under the new agency. It is the closest available proxy for when the new agency’s own work could have begun affecting the chart, which a contract date cannot tell you.
Is this the same issue as a case study picking a flattering baseline?
Related but distinct. A chosen baseline, covered in the ‘before’ picture in a case study is also a choice, is about which starting point makes the after-picture look strongest. This is about whether the credited agency was even working on the account during part of what the chart displays.
Sources
- The ‘Before’ Picture in a Case Study Is Also a Choice, fetched 2026-09-06
- The attribution window is a choice, and it is rarely disclosed, fetched 2026-09-06
- The counterfactual: the number no case study can show you, fetched 2026-09-06
- Social Case Studies case study library, fetched 2026-09-06