A Smoothed Results Line Moves Later Than What Moved It
The chart has a vertical line labelled “launch”, and the results line seems to bend upward right at it. You want that to be true, and it may well be. But a neat bend at the marker is exactly the thing worth a second look, because the line you are reading has probably been averaged, and averaging changes when things appear to happen.
The line turned up on launch day. Or did it?
Picture a case study chart of daily results with a launch marker. Before it the line wanders. After it, the line climbs. The caption says the campaign drove the lift.
The narrow claim of this post is this: smoothing changes when a change appears to happen, and how long a one-off event appears to last. Timing is what a causal claim rests on, since a campaign can only explain a rise that comes after it. For the broader habits, see reading a results chart before the caption.
Smoothing is not dishonest. Daily social data is noisy, and averaging is usually the right way to draw it. The issue is what a smoothed line can and cannot be used to argue. It shows level well and the exact start day poorly.
What a seven-day average actually computes
A trailing seven-day average gives each day the mean of that day and the six days before it. A centered seven-day average gives each day the mean of the three days before, the three days after, and the day itself. Wikipedia notes that a simple moving average not centered on the point lags the latest data by half the window width, and Forecasting: Principles and Practice describes the symmetric version, with the same number of observations either side.
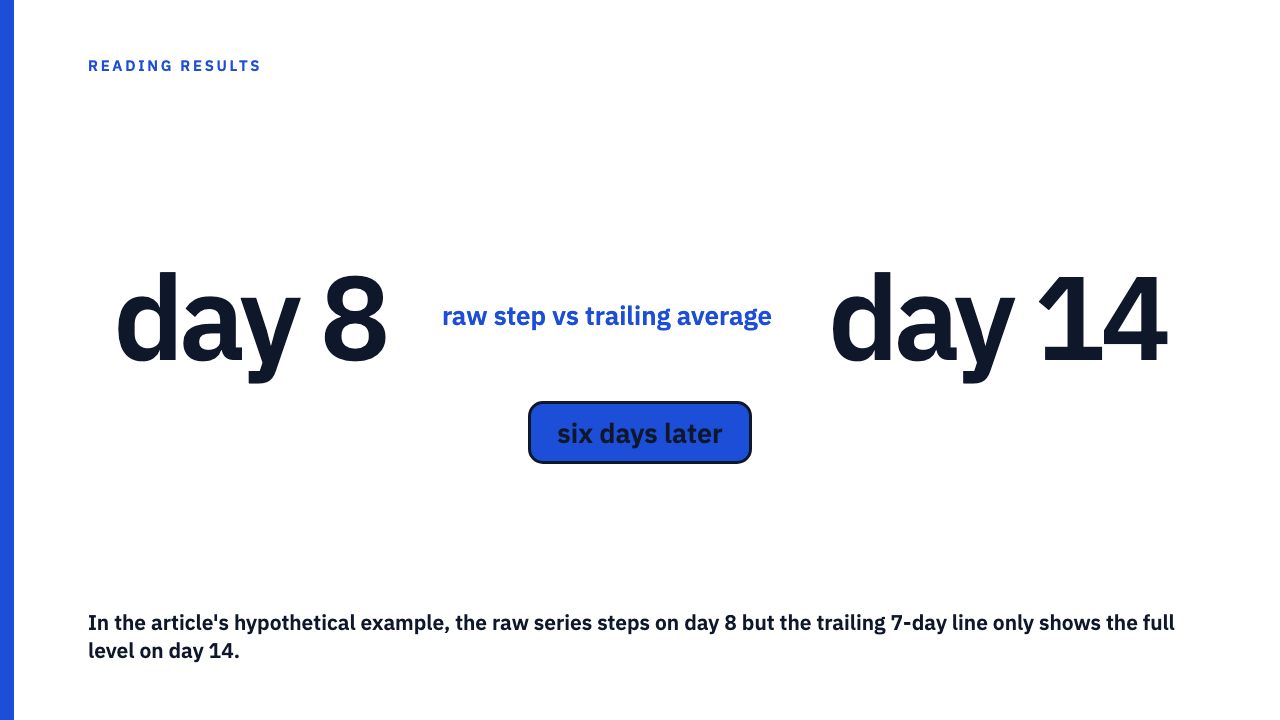
Each has a consequence for timing. On an abrupt step change, a trailing average needs the window length minus one days to catch up fully, so a seven-day trailing line needs six days after the change to show the new level. A centered average uses future days, so it begins to move three days before an abrupt change. On a centered line, a rise can appear to start before the launch, which no campaign can cause.
Case study charts rarely say which of the two was used. Some charting tools may default to trailing [EVIDENCE NEEDED: a specific tool’s documented default], so treat the type as unknown unless the chart states it.
A hypothetical step, worked by hand
HYPOTHETICAL daily numbers, not a reported result from any case study or from this library. Suppose the daily value is 100 on days 1 to 7, then steps to 160 on day 8, launch day, and stays there. Assume 100 before day 1 and 160 after day 14. Each smoothed cell is a sum divided by 7. Day 8 trailing, for example, is (6 x 100 + 160) / 7 = 760 / 7 = 108.6.
| Day | Raw daily (hypothetical) | Trailing 7-day | Centered 7-day |
|---|---|---|---|
| 4 | 100 | 100.0 | 100.0 |
| 5 | 100 | 100.0 | 108.6 |
| 6 | 100 | 100.0 | 117.1 |
| 7 | 100 | 100.0 | 125.7 |
| 8 (launch) | 160 | 108.6 | 134.3 |
| 9 | 160 | 117.1 | 142.9 |
| 10 | 160 | 125.7 | 151.4 |
| 11 | 160 | 134.3 | 160.0 |
| 12 | 160 | 142.9 | 160.0 |
| 13 | 160 | 151.4 | 160.0 |
| 14 | 160 | 160.0 | 160.0 |
Read it aloud. The raw series jumped by 60 on day 8, in one step. The trailing line does not show the full 160 until day 14. On the centered line, the climb starts on day 5, three days before launch.
Notice that the trailing line does bend on launch day here. So the neat-looking chart is consistent with a true launch effect. But the smoothed line alone cannot distinguish that from a rise that began a few days earlier at a smaller size.
Rise before the launch, and where it hides
Second hypothetical, invented for illustration. The daily value is 100 for days 1 to 3, then drifts upward for an unrelated reason: 100, 105, 110, 115 on days 4 to 7. On day 8 the launch adds a further step to 160, which holds. The trailing averages are 104.3 on day 7, 112.9 on day 8 and 121.4 on day 9. On the smoothed line the drift and the launch step blend into one slope, and the eye gives the whole slope to the launch.
A rise can start early for several reasons: a seasonal tailwind, a pricing or product change (see unrelated business changes during the campaign window), or a mention elsewhere.
The test is simple. On the raw series, is there any day before launch where the level is already clearly above the earlier baseline, and by how much compared with the metric’s normal noise?
One spike, seven days of plateau
The other failure runs the opposite way. Hypothetical again: the daily value is 100 every day except one day at 400. Any seven-day window containing that day sums to 6 x 100 + 400 = 1,000, so the trailing average reads 1,000 / 7, about 142.9, for seven consecutive days, then drops back to 100 on the eighth.
The reader sees a seven-day shelf near 143 that looks like a lasting 43 percent lift, built from one day. That 43 percent is an artefact of this made-up series, not a benchmark of anything. How to separate one post from a campaign is covered in single-post virality versus campaign performance.
What to ask for when timing is the argument
If the claim depends on when the line moved, these are the requests worth making:
- The raw daily (or hourly) series. It is the only place a pre-launch rise or a one-day spike is visible.
- The smoothing window, and whether it is trailing or centered.
- The go-live date, to the day, with a time zone if the platform reports in one.
- Any other change in the same window, such as price, product, or other channels.
A good answer looks like this: the raw series shown beneath or beside the smoothed line, the window stated in the axis label or caption, and the launch marker placed on the raw data. A screenshot cannot give you these on its own, which is why a screenshot is not the same evidence as a dashboard.
When smoothing is fine and timing does not matter
If the claim is about a sustained level across months rather than a start date, a smoothed line is a fair way to show it, and the lag is trivial relative to the period.
The rule: the shorter the gap between the launch and the claimed response, the less the smoothed line can tell you.
To see how credited agencies present their own charts, Browse the case study library, or submit your own.
FAQ
Does a seven-day moving average lag the real data?
If it is trailing, yes: it needs six days after an abrupt change to show the full new level, as the table above shows. A centered average does not lag, but it leaks future data backward, so it shows movement before the event.
How can I tell whether a chart in a case study is smoothed?
Look for a suspiciously smooth curve, no weekly wobble, a shelf after a single event, or a caption naming a window. If none of that is stated, treat it as unknown and ask.
Sources
- Moving average, Wikipedia, fetched 2026-10-11
- Time series decomposition, Forecasting: Principles and Practice, fetched 2026-10-11